Market commentary equities: How can active management perform in highly concentrated equity markets?
As market concentration continues to rise, investors are asking: How can active management deliver? Quoniam’s equity portfolio managers Andjelka Bannes, CFA, and Mark Frielinghaus, CFA, analyse the active performance of global equity managers over the past five years against a backdrop of increasing market concentration providing new insights and practical strategies for navigating index concentration and improving portfolio resilience.

Index concentration continues unabated – a historical review
Index concentration presents a significant challenge in modern portfolio management, impacting both active and passive investors. When a small number of companies increasingly dominate major indices, the risks associated with this concentration can undermine the benefits of diversification and heighten portfolio volatility.
Index concentration can be traced back through different periods:
- 1960s and early 1970s – the ‘Nifty Fifty’, a group of large-cap stocks such as IBM, Coca-Cola and McDonald’s, were seen as “one-decision stocks” because of their strong growth prospects. However, their dominance ended in the mid-1970s, partly because of their high valuations as conditions changed.
- 1990s – the rise of technology giants such as Microsoft, Cisco and Intel during the dot-com bubble drove the S&P 500 to new heights. This period ended with the bursting of the TMT bubble in 2000-2001, causing significant declines in the tech-heavy indices.
- Post 2008 financial crisis – the FAANMG stocks, Facebook, Apple, Amazon, Netflix, Microsoft and Google, emerged and evolved into the Mag 7 with Nvidia and Tesla. These companies grew to represent a significant portion of the S&P 500 and MSCI World, continuing the trend of concentrated market influence.
Today, the Mag 7 giants have a significant impact on the performance of the main indices. In 2015, however, the Mag 7 represented only a small part of the total market capitalisation of the index. By 2024, their share had increased dramatically, as the Mag 7 rose by 600% over the period, while the remaining 1400 stocks in the index rose by 100%.
Recently, the performance pattern of Mag 7 stocks has been overwhelming. As of July 2024, there have been 10 positive monthly returns of more than 5% over the past 18 months, while only 1 month has seen a decline of more than 5%.
The following chart shows the evolution of concentration in developed and emerging markets over more than 30 years.
Figure 1: Weight of ten largest stocks in MSCI World Index
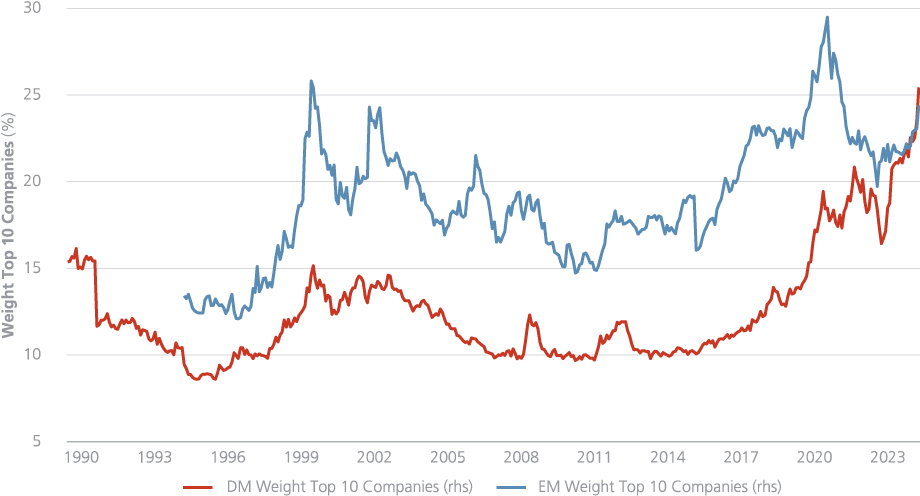
History shows that emerging markets experienced even higher concentration in the early 2020s before a sharp correction. In developed markets, led by the US equity market, concentration has risen to new highs.
It was only in Q2 that index concentration in developed markets overtook that in emerging markets for the first time in history. Unsurprisingly, the performance of the Mag 7 has remained stellar, with high double-digit returns year to date, while the S&P index has ‘only’ gained 15% in the first half of 2024. The single setback within the notorious group came from Tesla, which delivered negative absolute returns in 2024 as the demand and pricing environment for the EV market disappointed investors.
Does active management deliver in the era of Mag 7?
Although historically such levels of concentration are unlikely to be sustainable, investors clearly face the challenge of navigating the current market environment where the dominance of these companies in the wake of an AI boom may persist for the foreseeable future.
Index concentration is a particular challenge for active managers, who often underweight large-cap stocks to take positions in other attractive stocks. In fact, many investors question the effectiveness of active management and whether active stock selection can deliver.
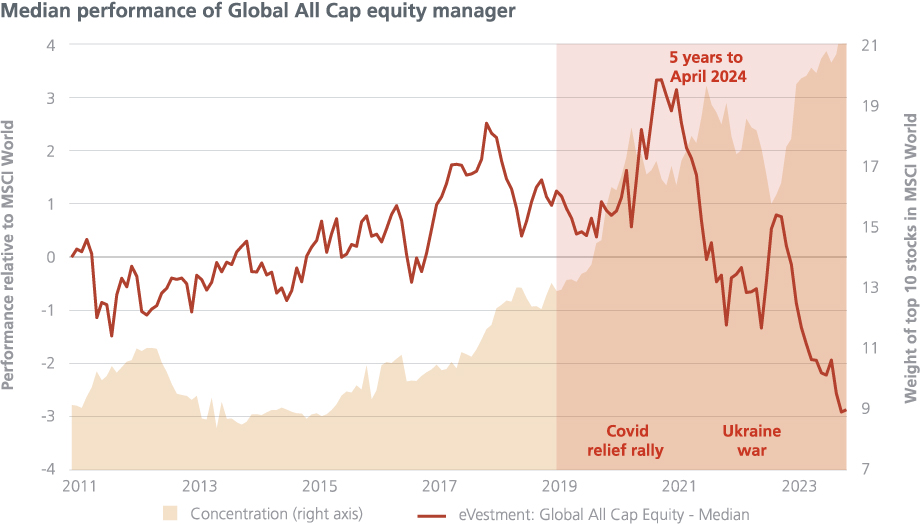
We have analysed the median performance of global all-cap equity managers as reported by eVestment over the last five years. As shown in the chart below, performance has struggled, with only two periods of outperformance by active managers: the COVID 19 relief rally and the value rally at the start of the Ukraine war. Despite these brief periods of outperformance, the overall performance trend has been downward.
Figure 2: Challenges: Active managers with high value/style exposure only outperformed during Covid relief and Ukraine war/energy rallies
Has active stock selection failed?
Digging deeper, we examined whether a factor-based approach to investing – focusing on value, quality and momentum – has been successful over the past five years.
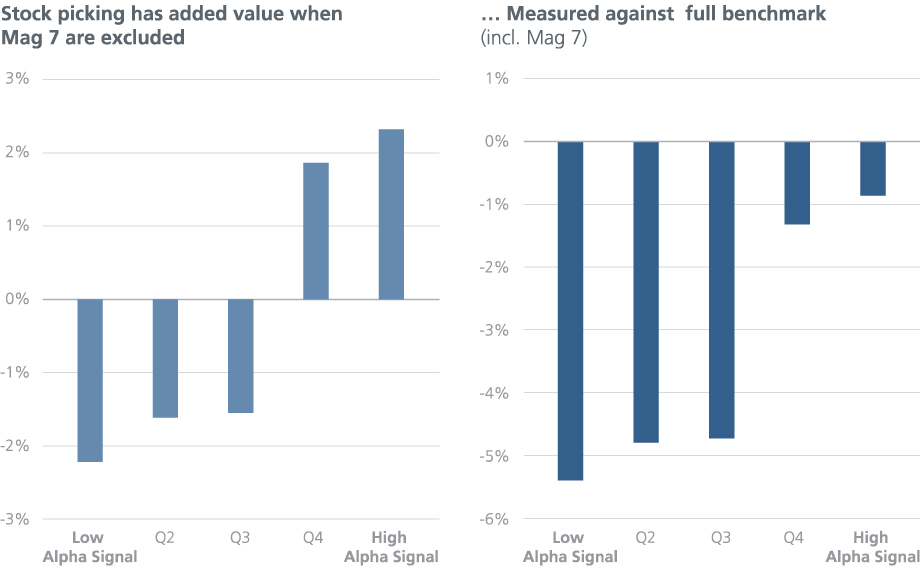
We sorted the largest 1,000 US stocks by these criteria and divided them into five portfolios. Excluding the Mag 7 (see graph on the left below), the portfolios constructed using low alpha signals underperformed the benchmark, while high alpha stocks outperformed. The return is linear: the higher the alpha, the higher the return, suggesting that this method of active stock selection was effective.
However, the result changes drastically when the Mag 7 are included in the analysis (see chart on the right below). Although the trend of higher alpha portfolios performing better and lower alpha portfolios performing worse persists, none of the portfolios outperformed the benchmark. This stark difference highlights the overwhelming influence of Mag 7 on recent market performance. These results suggest that active stock selection models do work, but they also highlight the need for investors to rethink their portfolio construction methods to include exposure to the Mag 7 if they expect these stocks to continue to outperform.
Figure 3: Performance of mega caps dominates otherwise successful stock selection
Higher TE strategies witness decreasing marginal return enhancements
A diversified long-only portfolio typically underweights large-cap stocks in order to allocate capital to other attractive opportunities across a range of market capitalisations. Investing heavily in a few large-cap names reduces the capital available for other investments. Consequently, a diversified portfolio that aims for a more balanced allocation is inherently underweight large-cap stocks relative to the benchmark index. The more active the strategy, the greater this underweighting becomes.
We have examined the trade-off between risk and return of active strategies in the current high concentration environment. The following graph shows the decreasing efficiency in adding additional units of tracking error in a long-only framework. We show these results based on repeated portfolio optimisations with different parametrisation implementing a multi-factor approach versus a market-cap weighted benchmark. The signal strength indicates the expected active returns based on the forecast model. Additional active returns decrease with increasing active risk. Hence the resulting information ratio (here: signal strength/tracking error) shrinks. A different construction method can resolve this by switching long-only approach for an active extension strategy (130/30). The efficient implementation of forecast signals, including negative forecasts, facilitates a more comparable risk-return ratio than a typical core approach.
Figure 4: Risk-adjusted return falls as the tracking error rises. An active extension approach is the exception.

What alternatives are available to investors?
- One approach is to stick to one’s active strategy and maintain dedicated underweights in concentrated market segments in order to finance specific overweights in favoured stocks. This approach necessitates a clear agreement between asset managers and owners on return and risk objectives with defined benchmarks guiding decision-making. Above all, it requires patience, persistence and the belief that mean reversion will unfold over time.
- Another option is to adopt a lower tracking error strategy, such as enhanced indexing: Enhanced indexing provides a balanced approach for investors seeking to minimise deviation from benchmark performance while seeking additional returns over passive strategies. It maintains comparable size exposure and concentration levels while optimising returns with limited deviation from the benchmark.
- The third option is to generate higher alpha through a different type of portfolio construction by adopting an active extension strategy (e.g. 130/30). This strategy, while characterised by higher tracking error, maintains a size and concentration level that deviates less than a high conviction long only active strategy. However, it has greater exposure to alpha factors than a long-only strategy. It is ideal for investors seeking higher relative returns through active management without having to take a view on the future performance of a small number of concentrated stocks.
Figure 5: Active extension may offer higher active returns in concentrated markets while tight position control (enhanced indexing) is an attractive alternative to passive

In summary, index concentration is a significant challenge in the current market environment, affecting both active and passive investors by increasing portfolio volatility and undermining diversification benefits.
We have discussed several strategies to address these challenges: maintaining a traditional active approach with a commitment to a long-term investment horizon; adopting a low tracking error strategy such as enhanced indexing to match benchmark performance while selectively enhancing returns; and seeking higher alpha through an active extension strategy without significant size and concentration deviations from the benchmark.